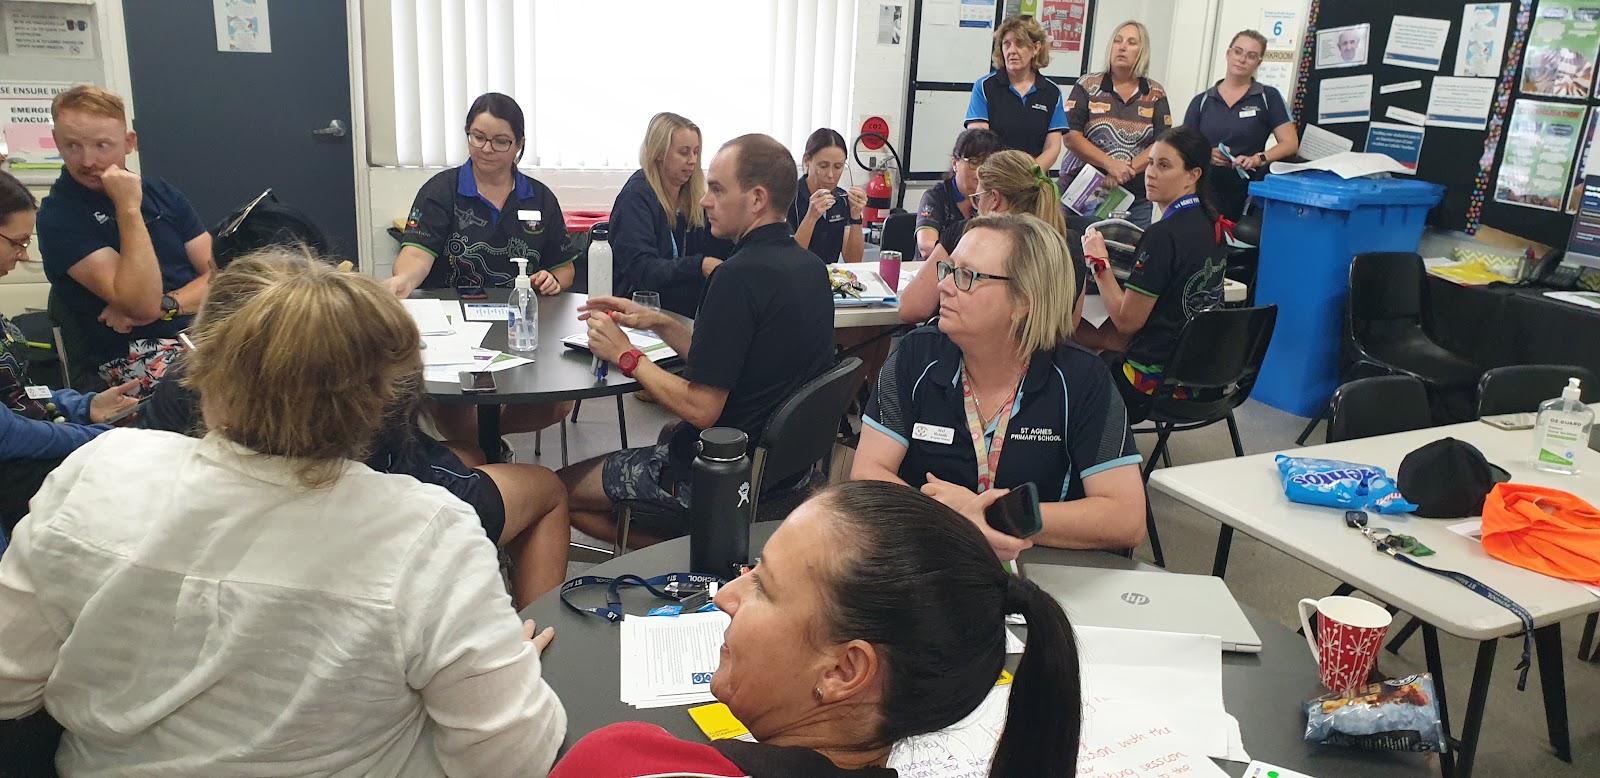
Using the fishbowl technique staff viewed a Case Management Meeting which involved the Principal, Year 2 teacher, Year 1 teacher (Knowledgeable Other) and Assistant Principal (Learning and Teaching). The team viewed the work sample provided by the Year 2 teacher. The teacher had the opportunity to share the student's profile and what instructional strategies had been trialled so far. Following the script, the Knowledgeable Others made suggestions for instruction and so did each table of teachers. The team will resume in three weeks time to review the impact of the instruction.
Staff agreed on the following practicalities:
Our next staff meeting was to determine what data would be used to create the data wall. Staff were asked to consider, given they were within the current reporting period, their current class and place students within the Venn Diagram. Many staff used their work samples to help confirm their judgements. Teacher Assistants looked over all three classes and gave insight regarding the students they work with in writing. Teachers then shared their diagrams with their grade partners to examine the entire cohort as a whole and give reasoning for placement.
Current writing samples are marked according to the NAPLAN criteria. Staff were asked to ascertain what three areas were causing students difficulty. These were then shared with the rest of the staff.
Staff reflected on the whole school data collected in the table and were asked whether they could see any alignment. Was there a K-2 trend and a 3-6 trend at all? Teams were give our present NAPLAN data in Year 3 and 5 and asked to consider whether this data confirmed or challenged our thinking.
.png)
Staff identified that sentence structure was holding students back across the entire school. In particular they could see that the NAPLAN marking aligned to particular outcomes of the syllabus and where a large percentage of vulnerability fell for our students. It was agreed upon that Sentence Structure within the Learning Progressions would be the area of focus for the data wall as a result.
.png)
.png)
.png)
.png)
.png)
.png)


Comments
Post a Comment